Using Portal Dashboards
Default Dashboard
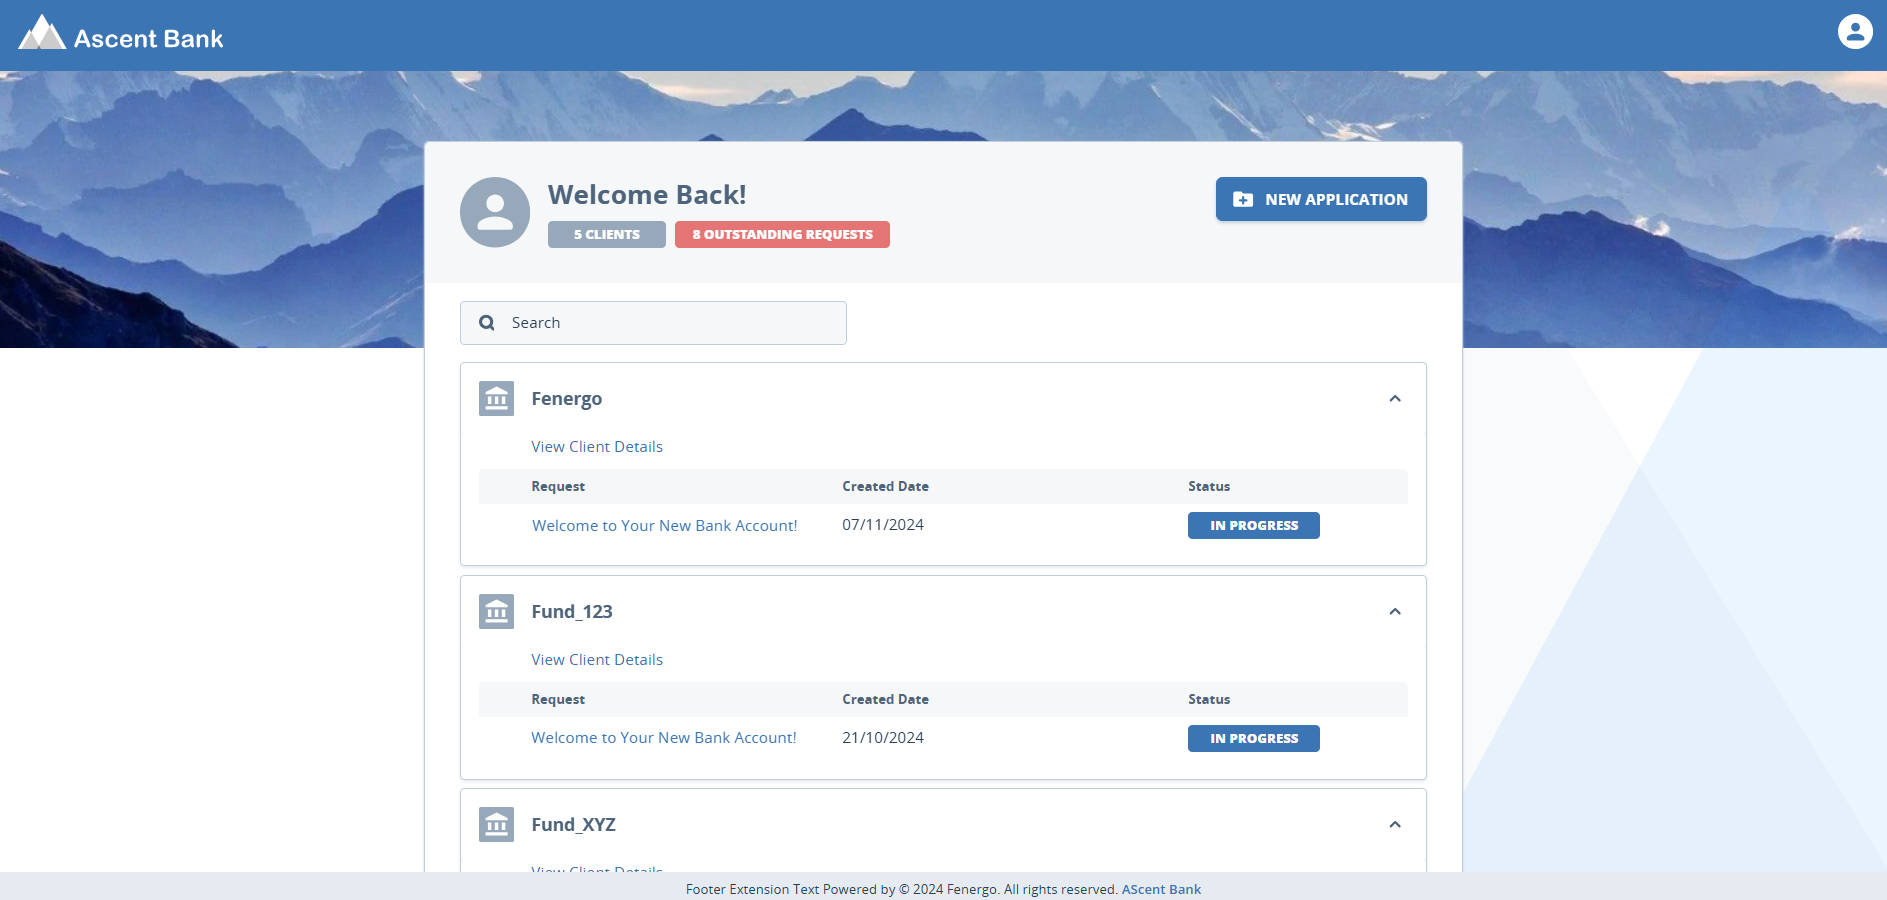
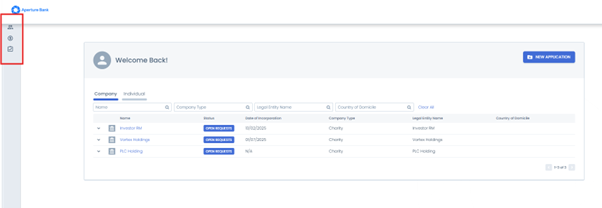
By default, the portal dashboard will display a list of linked legal entities and the status of their journeys. The Portal default dashboard cannot be edited. A user can search by name for both Individuals and Companies.
Why Use It?
The Default Dashboard provides a quick starting point for users who need a simple view of the entities they are linked to and the progress of related journeys. Because it is system-generated and not configurable, it ensures all users have at least one standard way to access their entities and track journey status without requiring setup.
Use Cases:
- General Client Access: External users logging in for the first time can immediately see their entities and journey statuses without needing a custom dashboard.
- Lightweight User Roles: Suited for roles where detailed entity information or configurable filters are unnecessary (e.g., occasional or read-only users).
- Small Entity Sets: Recommended for users linked to a relatively small number of entities (less than ~150), ensuring optimal dashboard performance.
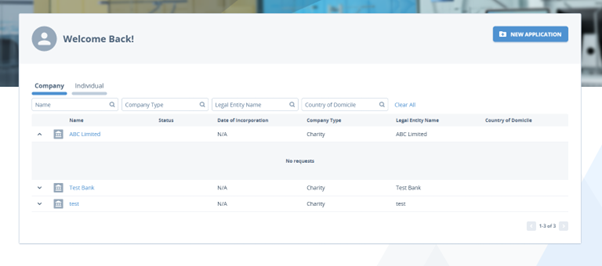
Configurable Dashboard
Multiple dashboards can be configured in the Portal Dashboards area. This allows clients to configure a dashboard to display additional datapoints to a user. These dashboard can then be assigned to a specific role via the Portal role configuration area.
Example of a configured dashboard:
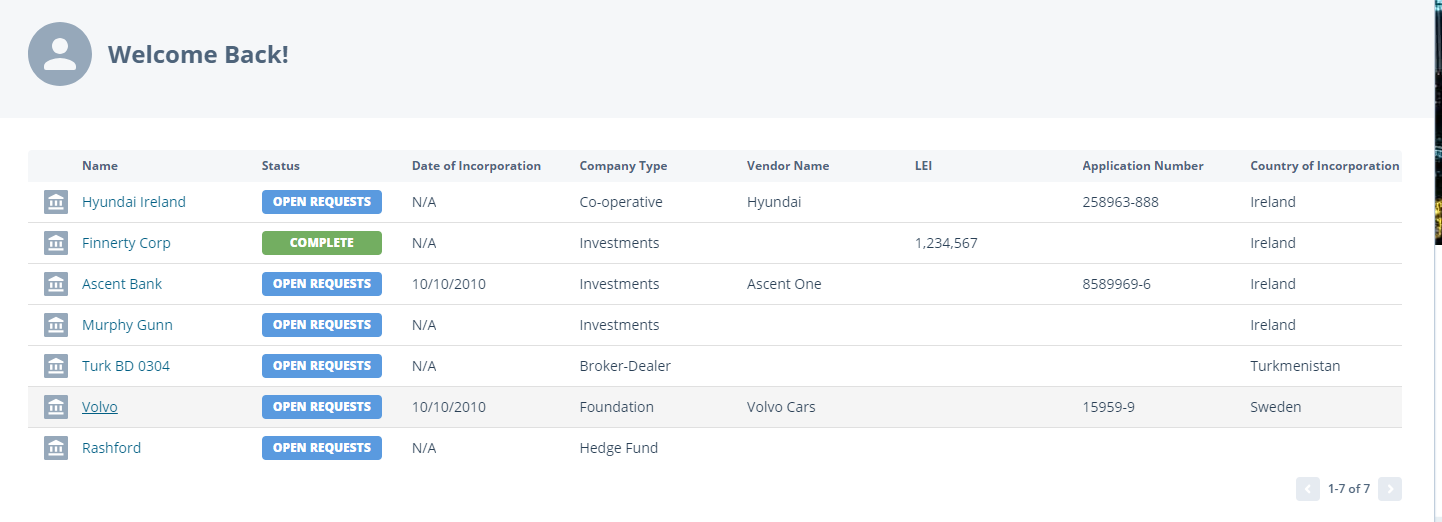
Note: There is currently a limit of 1000 LEs that can be linked and displayed on the configurable dashboards page.
To configure the Funds dashboard, please navigate to the Configuring the Fenergo Portal user guide > Funds Dashboards.
Why Use It?
The Configurable Dashboard provides customized visibility into entity data, enabling organizations to align dashboards with role-specific needs. By tailoring the displayed fields, admins can ensure users see only the most relevant information without overloading the screen.
Use Cases:
- Role-Specific Views: Provide compliance officers, relationship managers, or operational teams with dashboards focused on the data they care about.
- Enhanced Monitoring: Add extra datapoints such as client type, jurisdiction, or account status to support faster decision-making.
- Scaling with Larger Books of Business: Useful when users are linked to hundreds of entities and need structured columns to quickly filter or scan results.
Advanced Search Dashboard
The Advanced Search Dashboard introduces a dashboard type in the Standard Portal that enables Portal users to search for Company and Individual entities using configurable filters. It provides a table-based search experience for investor-related data.
When a Portal user enters a term into one of the configurable filters, the system queries the Fenergo system in real time, returning relevant entity results.
For more information on how to configure it, please visit the Configuration Guide.
Why Use It?
The Advanced Search Dashboard enables real-time, dynamic searching across the Fenergo dataset. It is designed to help users who need to discover entities beyond their directly linked set or who require advanced filtering and investigative capabilities.
Use Cases:
- Investor Relations Teams: Quickly locate individuals or companies using identifiers such as ID, country, or incorporation date.
- Large Data Environments: Support for real-time searching across wide datasets where static dashboards become unwieldy.
- Flexible Research & Due Diligence: Useful for analysts who need to perform cross-entity research and validate data consistency.
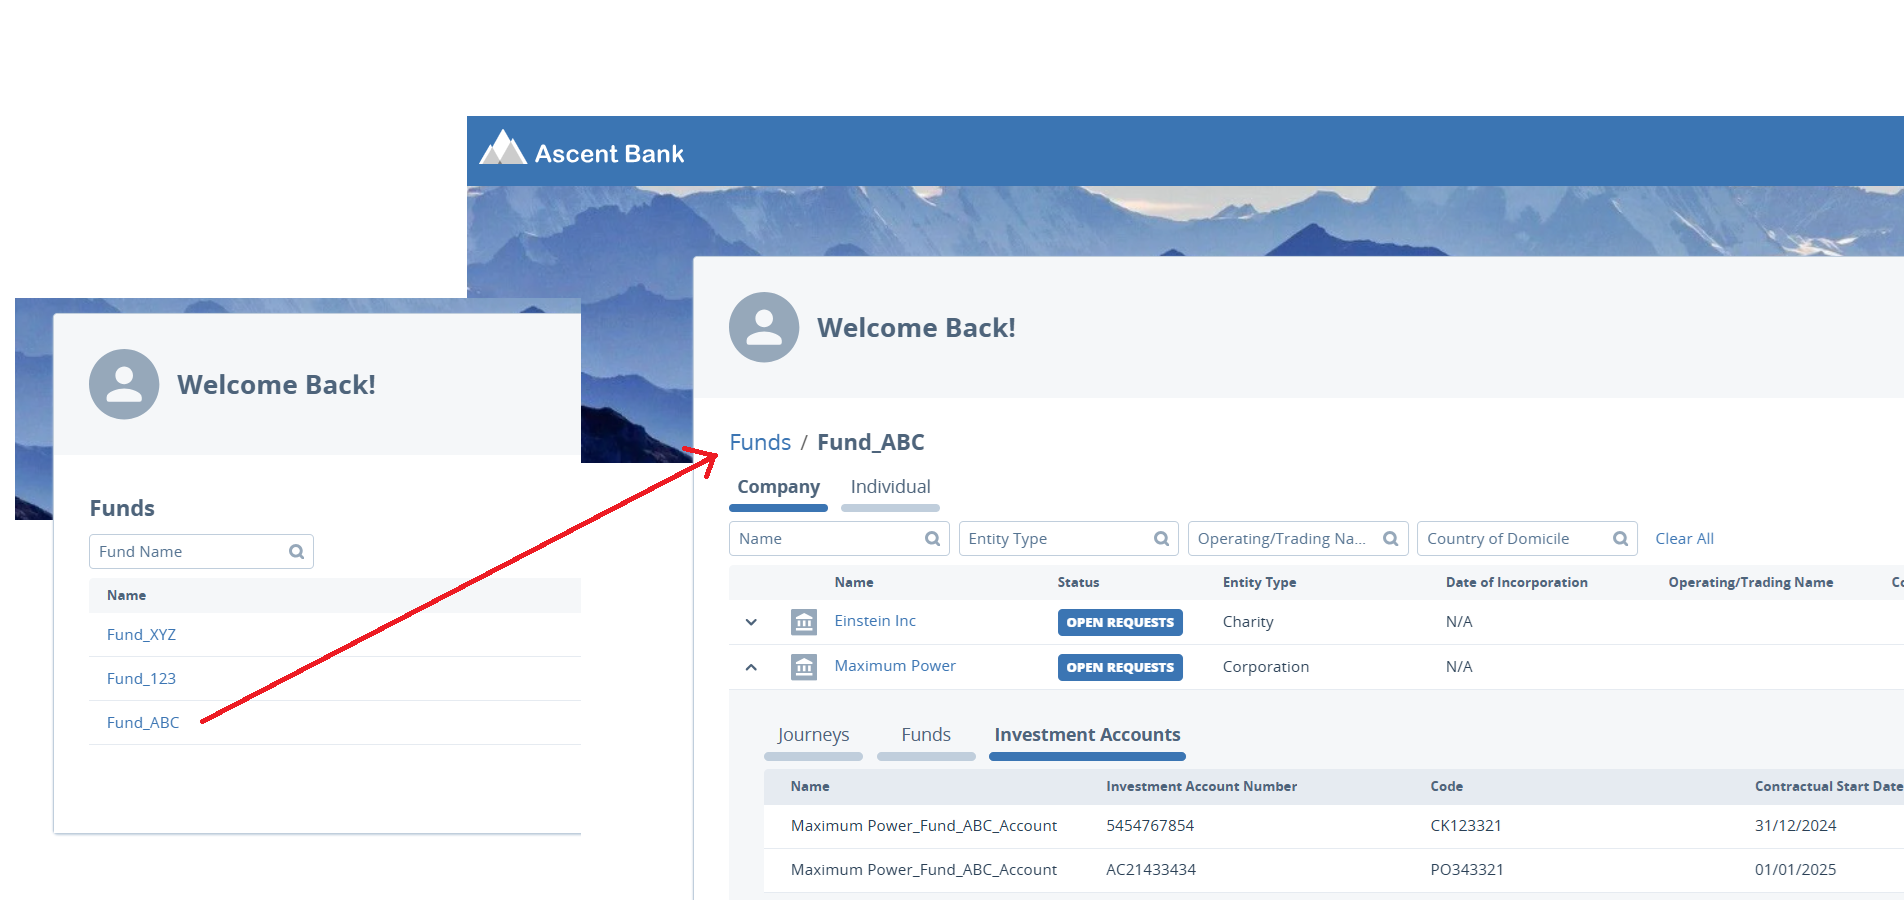
Funds Dashboard & Optimised Investor Linking
Fund managers now have expanded access and visibility on the Portal dashboard when a Funds Dashboard is configured. For this Fund specific view there is a few key points to be aware of:
- The Fund Manager portal user can be linked to a fund either through a Quick Link task during fund setup in Fenergo or via the Portal User Management area.
- Once linked, the system automatically displays all investors for that fund who have an onboarded investment account. This eliminates the need for manually linking and unlinking investors to a portal user, as access is now managed by the investment account status and the Fund Manager/Portal User link at the fund level.
Example of a Funds Dashboard:
-
Dashboard Enhancements
-
Fund Filtering: Fund managers can now filter and search for specific funds directly on their dashboards.
-
Autoview of Investors: When a fund is selected, all investors with at least one onboarded investment account will be visible within the fund.
-
Investment Accounts: When an investor record is expanded, an Investment Accounts tab shows an overview of key investment data.
- Only investors with Onboarded investment accounts will be visible.
-
Funds Tab: A new Funds tab displays funds an investor is involved in, where the fund manager is directly linked as a portal user. Funds not linked to the portal user are not visible in Portal.
-
Journeys Tab: Displays all journeys related to an investor. If the journeys toggle is disabled, this tab will not be shown.
infoThere is currently a limit of 1000 LEs/Investors that can be displayed per Fund on the funds dashboards page.
An active investment account is an investment account with an Onboarded status. Onboarding and Offboarded investment accounts are not displayed to the Portal User. Investors with only Onboarding or Offboarded investment accounts will also not appear on the dashboard.
-
-
Tab Structure and Order
The information on the investor dashboard is organized into the following tabs:
- Journeys
- Funds
- Investment Accounts
This consistent structure enables fund managers to easily navigate between journeys, investment accounts, and fund overviews.
-
Permissions and Display Logic
- Permissions: Only funds where the fund manager has viewing rights and the investor has an onboarded investment account are displayed.
- Conditional Display: Tabs such as Journeys are shown based on toggle settings; if the toggle is disabled, they will not appear on the dashboard.
To view how to configure a Funds dashboard, please refer to the Configuring the Fenergo Portal User guide. Note: There is currently a limit of 1000 LEs/Investors that can be displayed per Fund on the funds dashboards page.
To configure the Funds dashboard, please navigate to the Configuring the Fenergo Portal user guide > Funds Dashboards.
Why Use It?
The Funds Dashboard is designed to simplify fund management by automatically surfacing investors associated with a fund. It removes the manual burden of linking/unlinking investors, ensuring data is always synchronized with investment account status.
Use Cases:
- Fund Managers: View all active investors across funds they manage, filtered by onboarded status.
- Investment Oversight: Navigate seamlessly between investors, their investment accounts, and related journeys.
- Operational Efficiency: Reduces manual linking, ensuring cleaner data governance and faster access for fund-focused teams.
Outreach Requests Dashboard
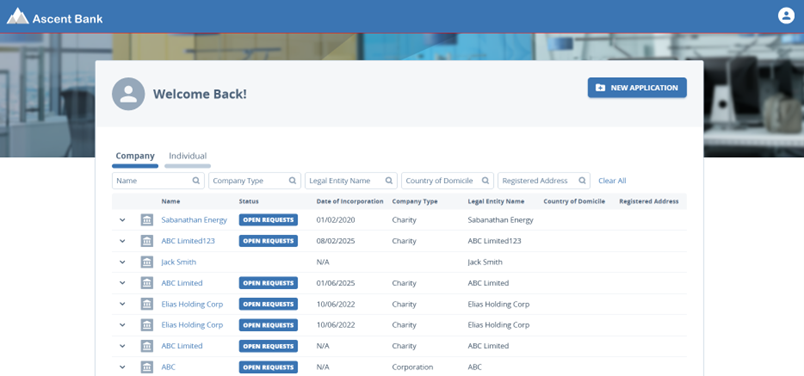
The Outreach Requests Dashboard is designed to allow Portal users to focus only on entities that have open requests. This feature will make it easier for users to take action on pending Outreach tasks. The dashboard has two tabs, Company and Individual. Users are able to use filtering capabilities and search to find entities.
Note: Only journeys linked to the Portal user will appear on this dashboard. A journey is linked to a Portal user through the Create Outreach Snapshot task. If the Link Journey toggle is enabled, the journey will be assigned to all Portal users associated with the Legal Entity and have the assigned role for the outreach stage. If no role is assigned to the outreach stage, no journeys are linked to any user.
When a user completes all tasks in an outreach stage, the Import Snapshot task is marked as complete. If the Unlink Journey toggle is enabled on the Import Outreach Snapshot task, the journey will be unlinked from the user, and the journey/entity will no longer appear on the Requests dashboard.
In addition to the Entity Name column, the dashboard will also display configurable columns.
Note:
-
Outreach request links when journeys are cancelled or are older than 365 days will be automatically removed.
-
If a journey has been referred to a previous stage, the portal user will be presented with an information screen indicating that the request is no longer valid and will be removed from their dashboard.
Please refer to the Configuration Guide on how to configure the Outreach Requests Dashboard.
Why Use It?
The Outreach Requests Dashboard provides a task-centric view, helping users prioritize outstanding requests without scanning through all entities. It ensures users can immediately act on pending outreach tasks, improving completion rates and reducing delays.
Use Cases:
- Client Outreach: Provides external users with a focused view of pending outreach actions (e.g., document uploads, data updates).
- Task Prioritization: Helps internal users and relationship managers quickly identify which clients require attention.
- Compliance Efficiency: Supports audit and regulatory needs by ensuring no pending outreach request is overlooked.
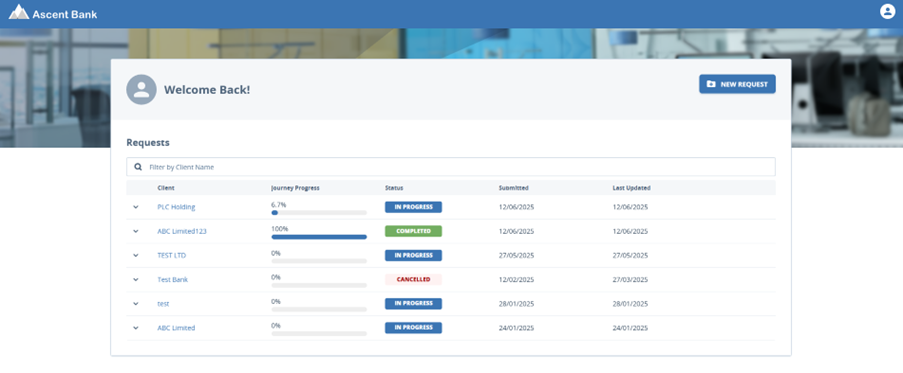
Trader Requests Dashboard
The Requests Dashboard is the default dashboard available when the Trader Portal is configured. Unlike other dashboards, it cannot be configured.
This dashboard provides Sales users with an at-a-glance view of all the requests they have submitted, including both active and completed requests. The dashboard offers full transparency into each request’s current status and progress, helping users stay organized and up to date.
Key functional details:
- Displays both active and completed trader requests in a single view.
- Columns include Client, Journey Progress, Status, Submitted Date, and Last Updated Date.
- Requests can be expanded to show additional details, including products associated with the client and journey-level metadata.
- First-time users will see an empty state until their first request is submitted.
- Requests automatically update as they move through the onboarding or product setup journey.
Why Use It?
The Trader Requests Dashboard centralizes all sales-initiated requests into a single workspace. It allows Sales users to easily track the lifecycle of new client onboardings or product setups, without needing to navigate into each individual journey.
Use Cases:
- Sales Visibility: Sales teams can track the progress of client onboarding or product setup requests in real time.
- Operational Transparency: Eliminates back-and-forth with operations by showing status directly in the dashboard.
- Efficiency for Repeat Requests: Expanding rows allow quick access to request details, products, and client data without leaving the dashboard.
- First-Time User Simplicity: Even without configuration, new users can immediately begin tracking requests once submitted.
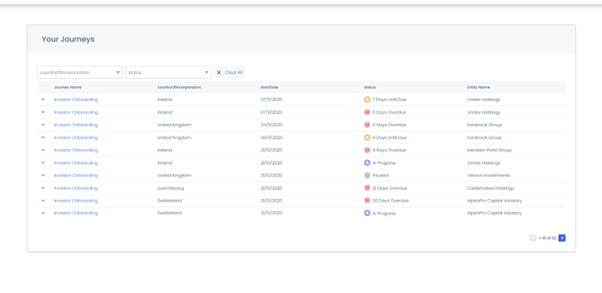
Journeys Dashboard
The Journeys Dashboard allows users such as Fund Managers to view and track the progress of all journeys currently in progress for their associated investors.
This provides a single, consolidated view of journey activity. The dashboard helps users monitor onboarding or review journeys without having to access the Fenergo system, improving insight for external users.
Portal users can use the multi-filtering capabilities to narrow down their search for the specific journey they want to view.
For more information on configuring the Journeys Dashboard, please visit Configurating Portal Dashboards
Display Journey Information
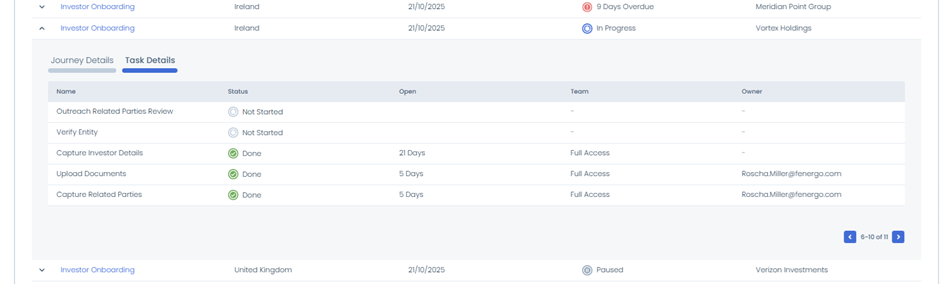
The Journeys Dashboard provides Portal users with a consolidated view of their in-flight journeys. Enhancements to this dashboard ensures users can be directly navigated into a Journey Overview by clicking on a journey name, review associated data and documents and view information consistent to the Profile Page V2 experience.
Each journey row can be expanded to reveal additional details in two tabs.
- Journey Details Tab: displaying high-level details about the selected journey.
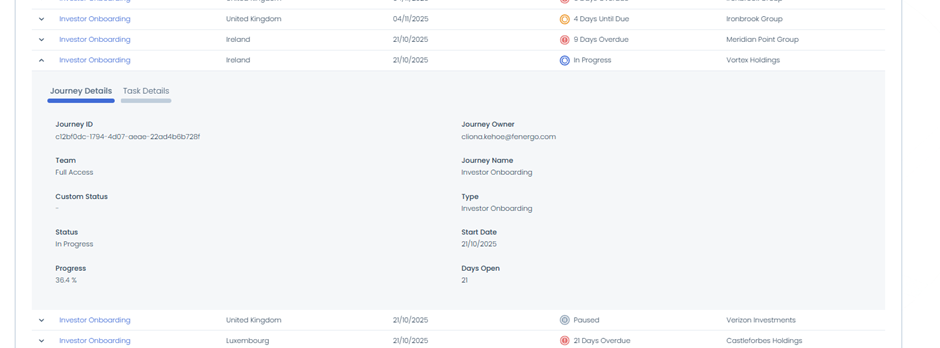
- Task Details Tab: provides task progression for the journey and other helpful information such as the status of the task, when it was started and who it was assigned to.
Journey Details Page
The Journey Name column is now clickable.
When clicked the Portal user is navigated to the Journey Details page.
This section displays four possible sections:
- Data
- Documents
- Investment Accounts - onboarded only
- Products
These sections will only display if Profile Page V2 is enabled. All content aligns with the configuration defined for Profile Page V2.
Enabling Multiple Roles/Dashboards to be assigned
Portal users can now be assigned multiple roles in order to have access to multiple dashboards within the Portal, enriching the overall Portal experience and giving users more flexibility in how they interact with the system.
With this enhancement, users can be assigned up to five roles. Thus, allowing users to be able to access multiple dashboards within the Portal.
Role Switching
When a user has more than one role assigned, a Dashboard View Switcher appears in the left-hand navigation of the Portal. Portal users can use this to directly switch between different dashboard views. Hovering over each icon will display the name of the dashboard.
For more information on the configuration of this, please visit the Configuring the Fenergo Portal Guide.
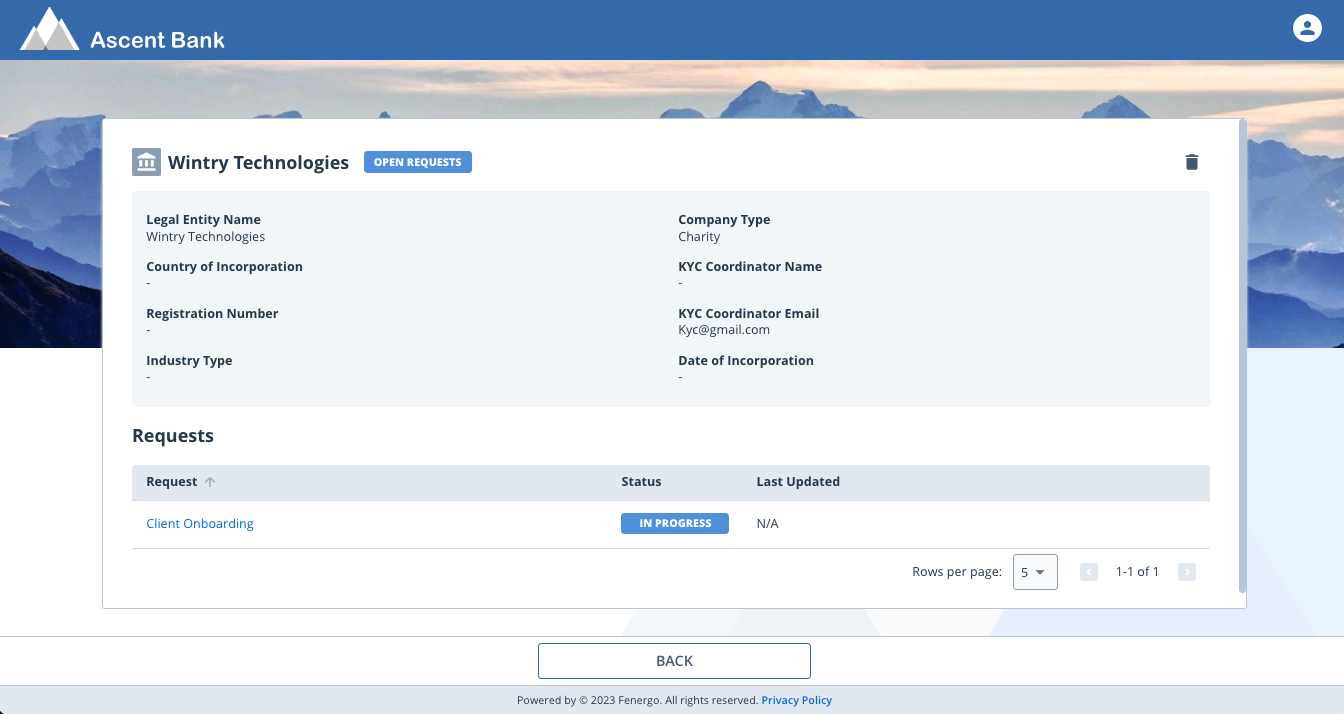
Navigation to Entity Page
From each Dashboard, the journey page or a task, users can click on the Legal Entity name to redirect to the Legal Entity Page. Here they will see details of their Legal Entity, depending on which fields and requirement category they have configured. The portal will show Basic Details by default, filtering appropriately for Individuals or Companys. The user will also see all the external journeys for this Entity and can access them directly from here.